
Microsoft Office is a tightly integrated application suite. Inside Excel you can find pretty much the entire arsenal of PowerPoint drawing and charting tools.
 The only drawback is that you end up presenting the charts inside Excel on the screen with all the menu bars visible. On the other hand, this allows you to move back and forth between charts and data quickly.
For certain types of presentations, you should consider using Excel as the presentation tool instead of PowerPoint. Quarterly results presentations are an obvious candidate:
- Massive amounts of dense data, and a need to switch back and forth between graphs showing trends, and the actual data tables itself
- Time pressure; the numbers come in fresh from the accounting systems and need to go straight into the Board document, without sufficient time to analyze what actually is going on.
- Presentations that need to be updated all the time but basically look the same: quarterly results (again), market share movements. Every time the data arrives in the exactly the same format, with a column added. Lots of time is lost with copying and pasting data across. The result is usually ugly Excel tables featuring in a PowerPoint slide.
- Complex analysis that needs to be redone, i.e., a water fall chart explaining the difference between this quarter and last quarter's results. Very few know how to do this. Even fewer know how to visualize this in a PowerPoint graph. A smart Excel template can help.
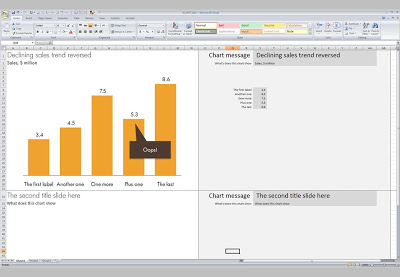
Here is what an Excel presentation could look like. Charts are laid out on the left side, data is put in on the right side. It takes some time setting things up and making all the links work, but once you do, you got yourself a very powerful tool (click image for a larger picture).
The only drawback is that you end up presenting the charts inside Excel on the screen with all the menu bars visible. On the other hand, this allows you to move back and forth between charts and data quickly.
Some guidance on how to set things up:
- Once you have set the font sizes for the titles and subtitles, do not touch column and row sizes anymore. Do a print preview to see where the page breaks show up.
- Switch on "snap to grid" to get all the shapes and graphs nicely aligned. (Click an object, format tab, arrange, align, snap to grid)
- You can get to the PowerPoint objects by selecting "insert" and then "shapes"
- Fill you cells with white to get rid of the grid lines
- Lock cells after you are done with setting up the template
- After the automated steps are completed, review your Excel presentation manually to add comments and see whether everything makes sense
SlideMagic: a platform for magical presentations. Free student plan available.