

I am learning a lot from the search bar in my template store, especially those searches that (still) deliver zero results. "Waterfall" is one of those.
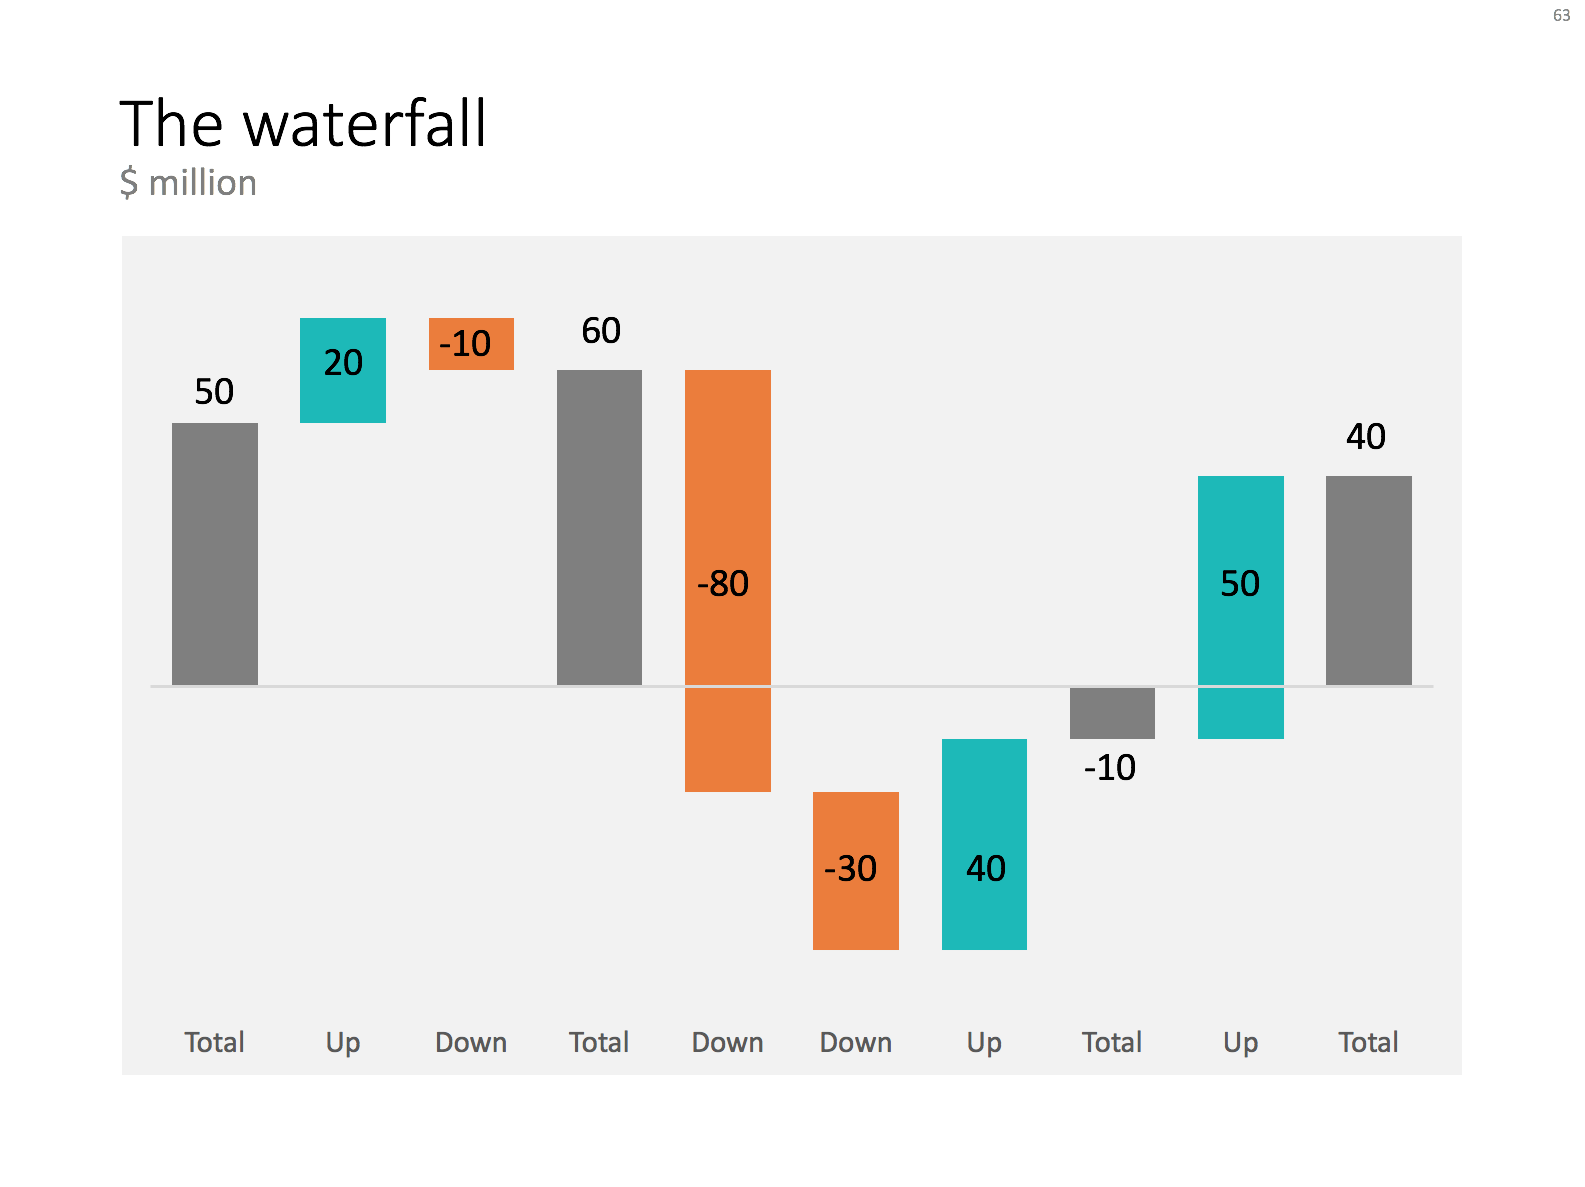
Waterfall charts are the secret weapon of McKinsey and other strategy consultants. They are great to explain the source of change between two values (last year, this year for example). In Excel they are tricky to make, especially if values zoom up and down the zero axis.
In an earlier blog post (all the way back in 2008, nine years ago...), I explained the basics of creating waterfall charts in Excel. The secret is to make blank series in a stacked column chart that create the requires offset for the delta values.
For my store, I am working on an automated tool that creates waterfalls. It is still work in progress though, I want to to be very robust.
In the mean time, I have added a manual version of the waterfall to my template store. I created the general layout, fixed the colours. Still you will have to do some calculations and adjustments to make it fit your specific set of numbers. Also, you will need to add data labels manually. But with a bit of fiddling, you should get a good result.
Work in progress.