

Waterfall charts have emerged in PowerPoint for Mac after a recent software update. This would be a major addition, since these types of charts are highly useful to summarise changes in data. I have shown in previous blog posts how it is possible to construct a waterfall chart starting from a regular stacked column chart, but it involves manual calculations and PowerPoint fiddling.
The new waterfall templates for PowerPoint for Mac are a step in the right direction, but things are not perfect (yet) though. For some reason, you cannot edit the data of the waterfall that gets inserted in PowerPoint, nor can you change the design of the chart. I figured out a work around:

1. Data in the standard PowerPoint for Mac waterfall chart cannot be edited ("edit data in Excel" is grey out)
2. The only adjustment you can make is selecting a cell, and then designating it to be a total column (or not)
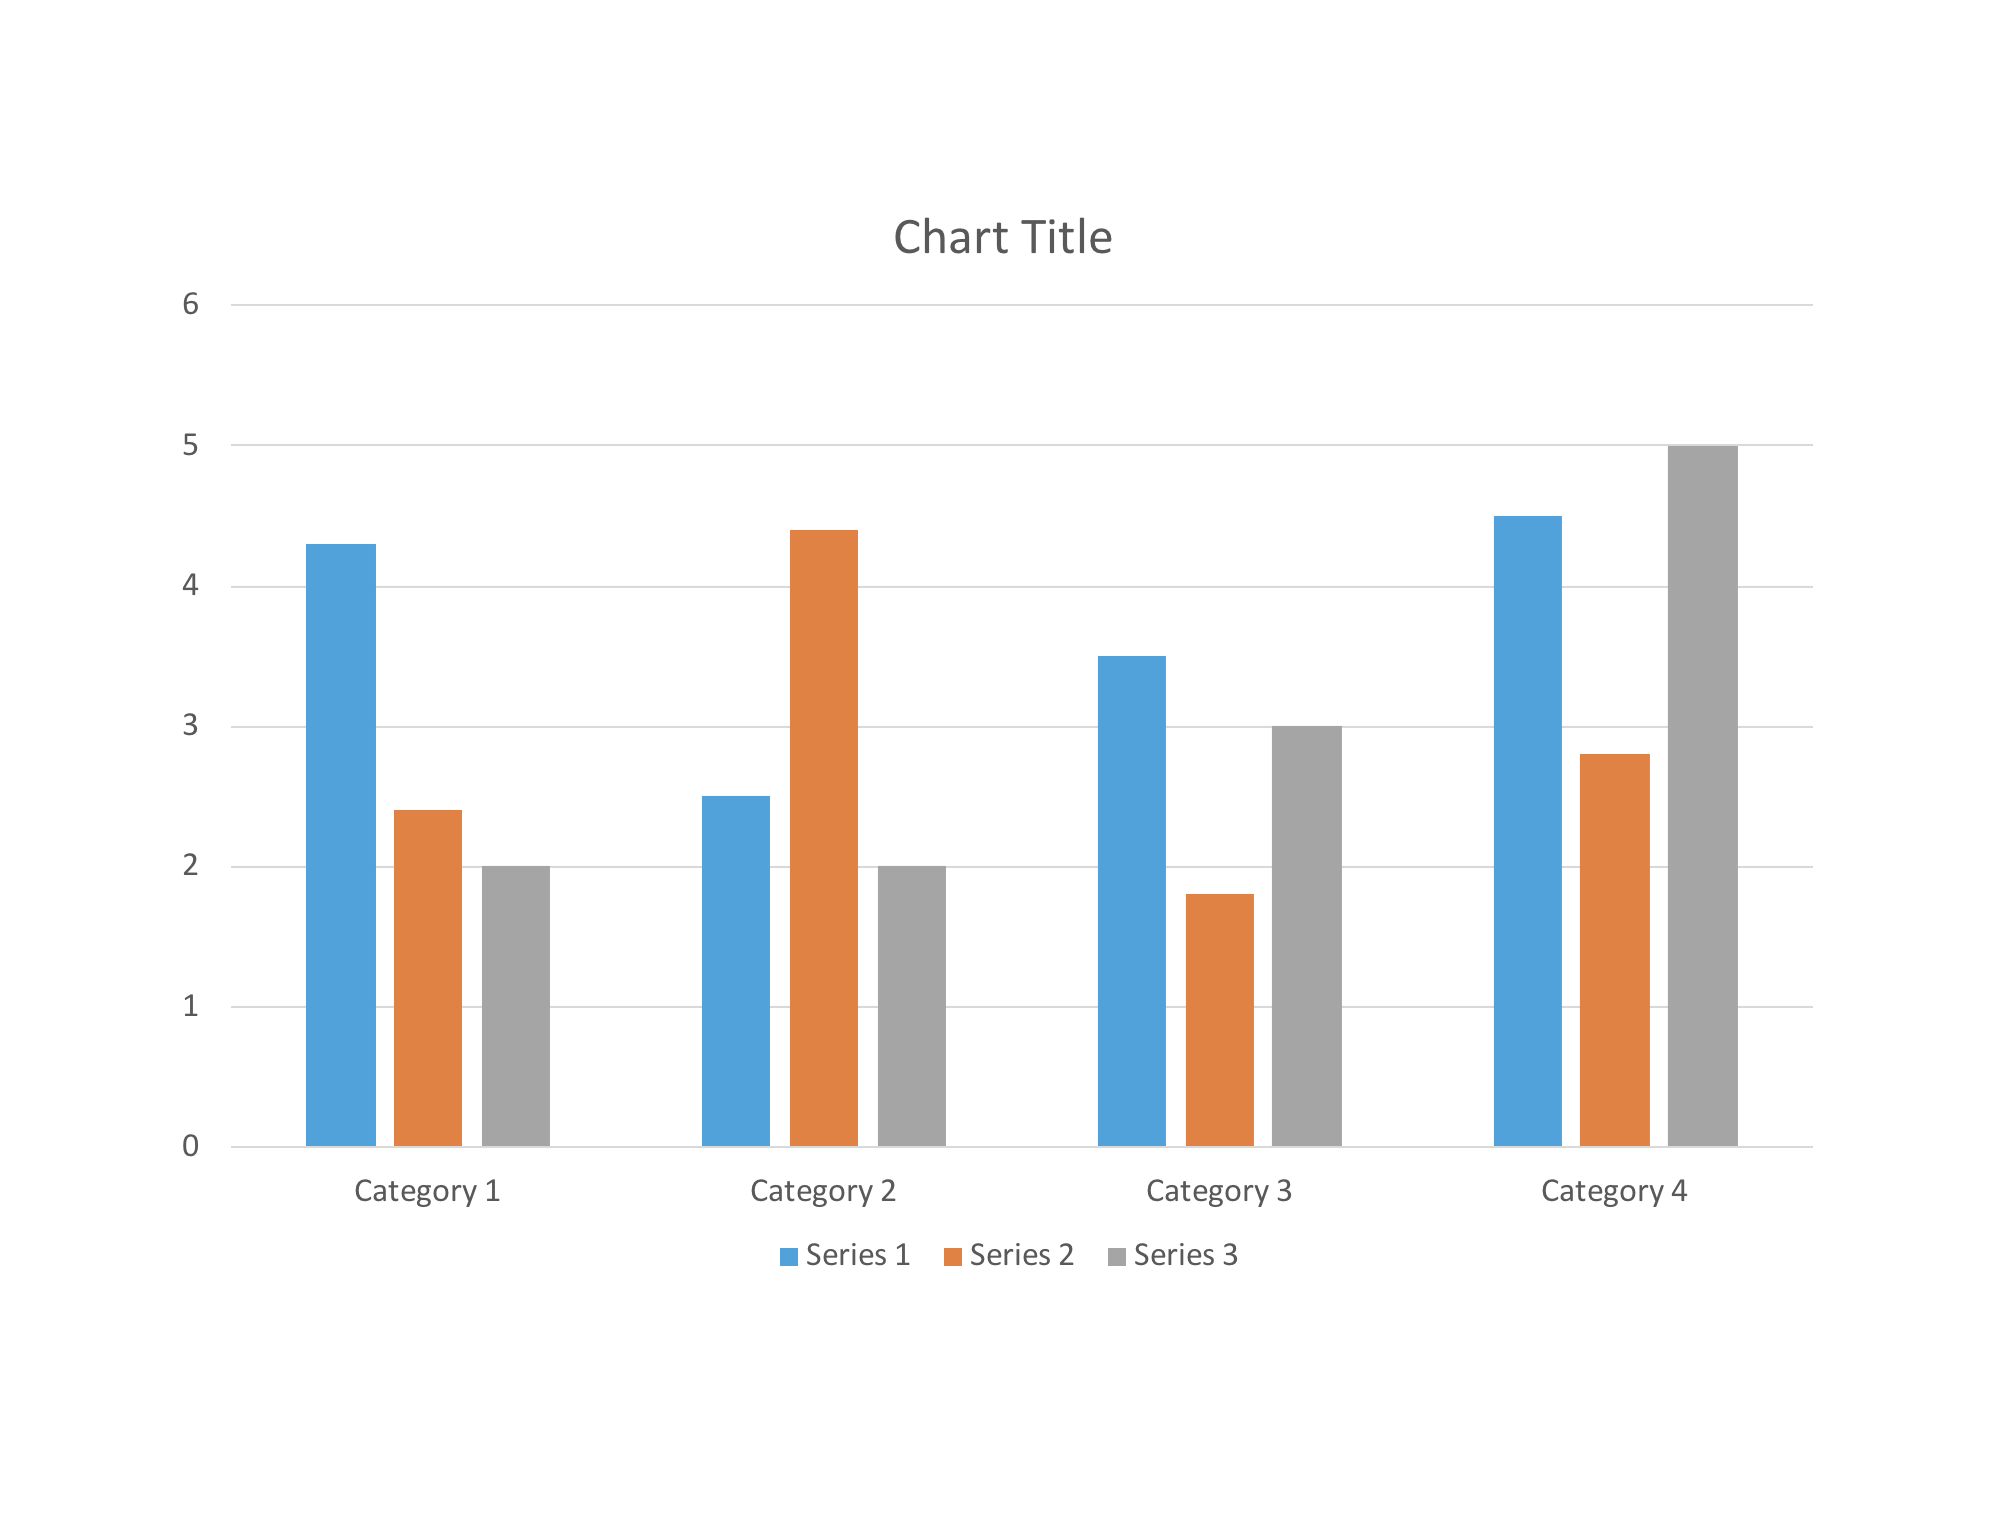
3. Work around: add a regular column chart

4. Make it a stacked column

5. Delete data all but one data series

6. Add the data you need

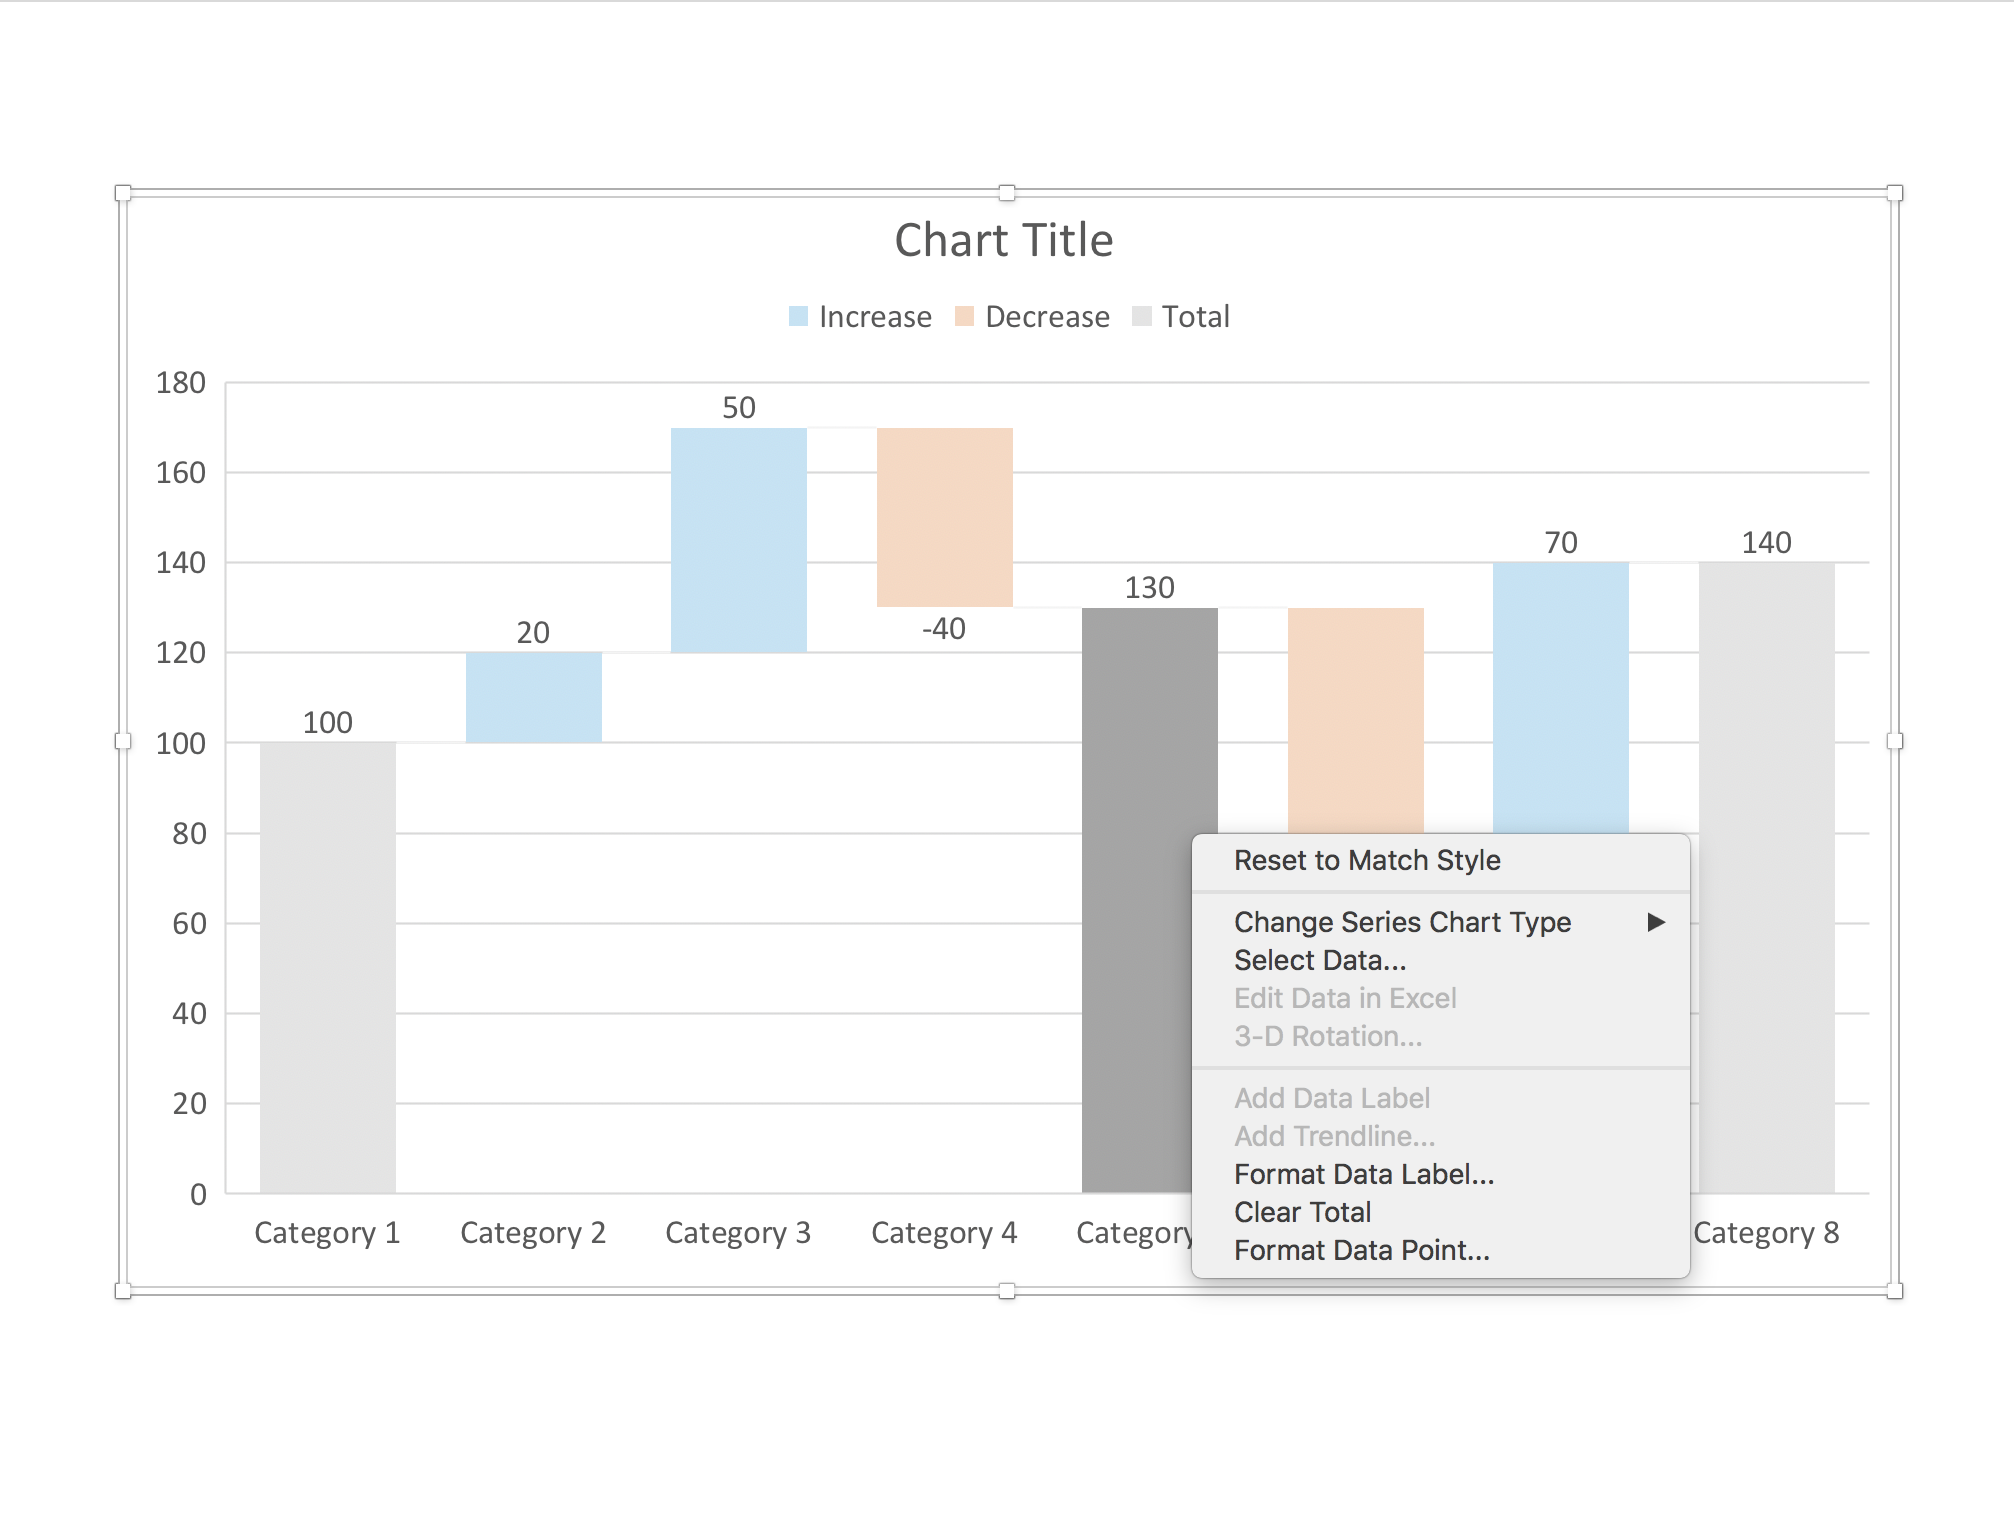
7. Convert the stacked bar to a waterfall

8. Designate the totals to be "totals"

9. The final result
The problem is that you cannot format these chart more to make it fit in your overall design. And to change a data value, you have to convert back the chart to a stacked column chart, after which you have to re-re-convert to a waterfall and set the totals again from scratch.
I assume these are all early bugs that will eventually be ironed out. Do people have the same issue on PowerPoint for Windows?
Here is the link to my manual waterfall chart in the template store. It requires some calculations, but once set up, you can make it fit to your own look & feel, and changing data values should be relatively easy. As soon as Microsoft has ironed the above bugs, I will update this chart to work with the native chart engine.
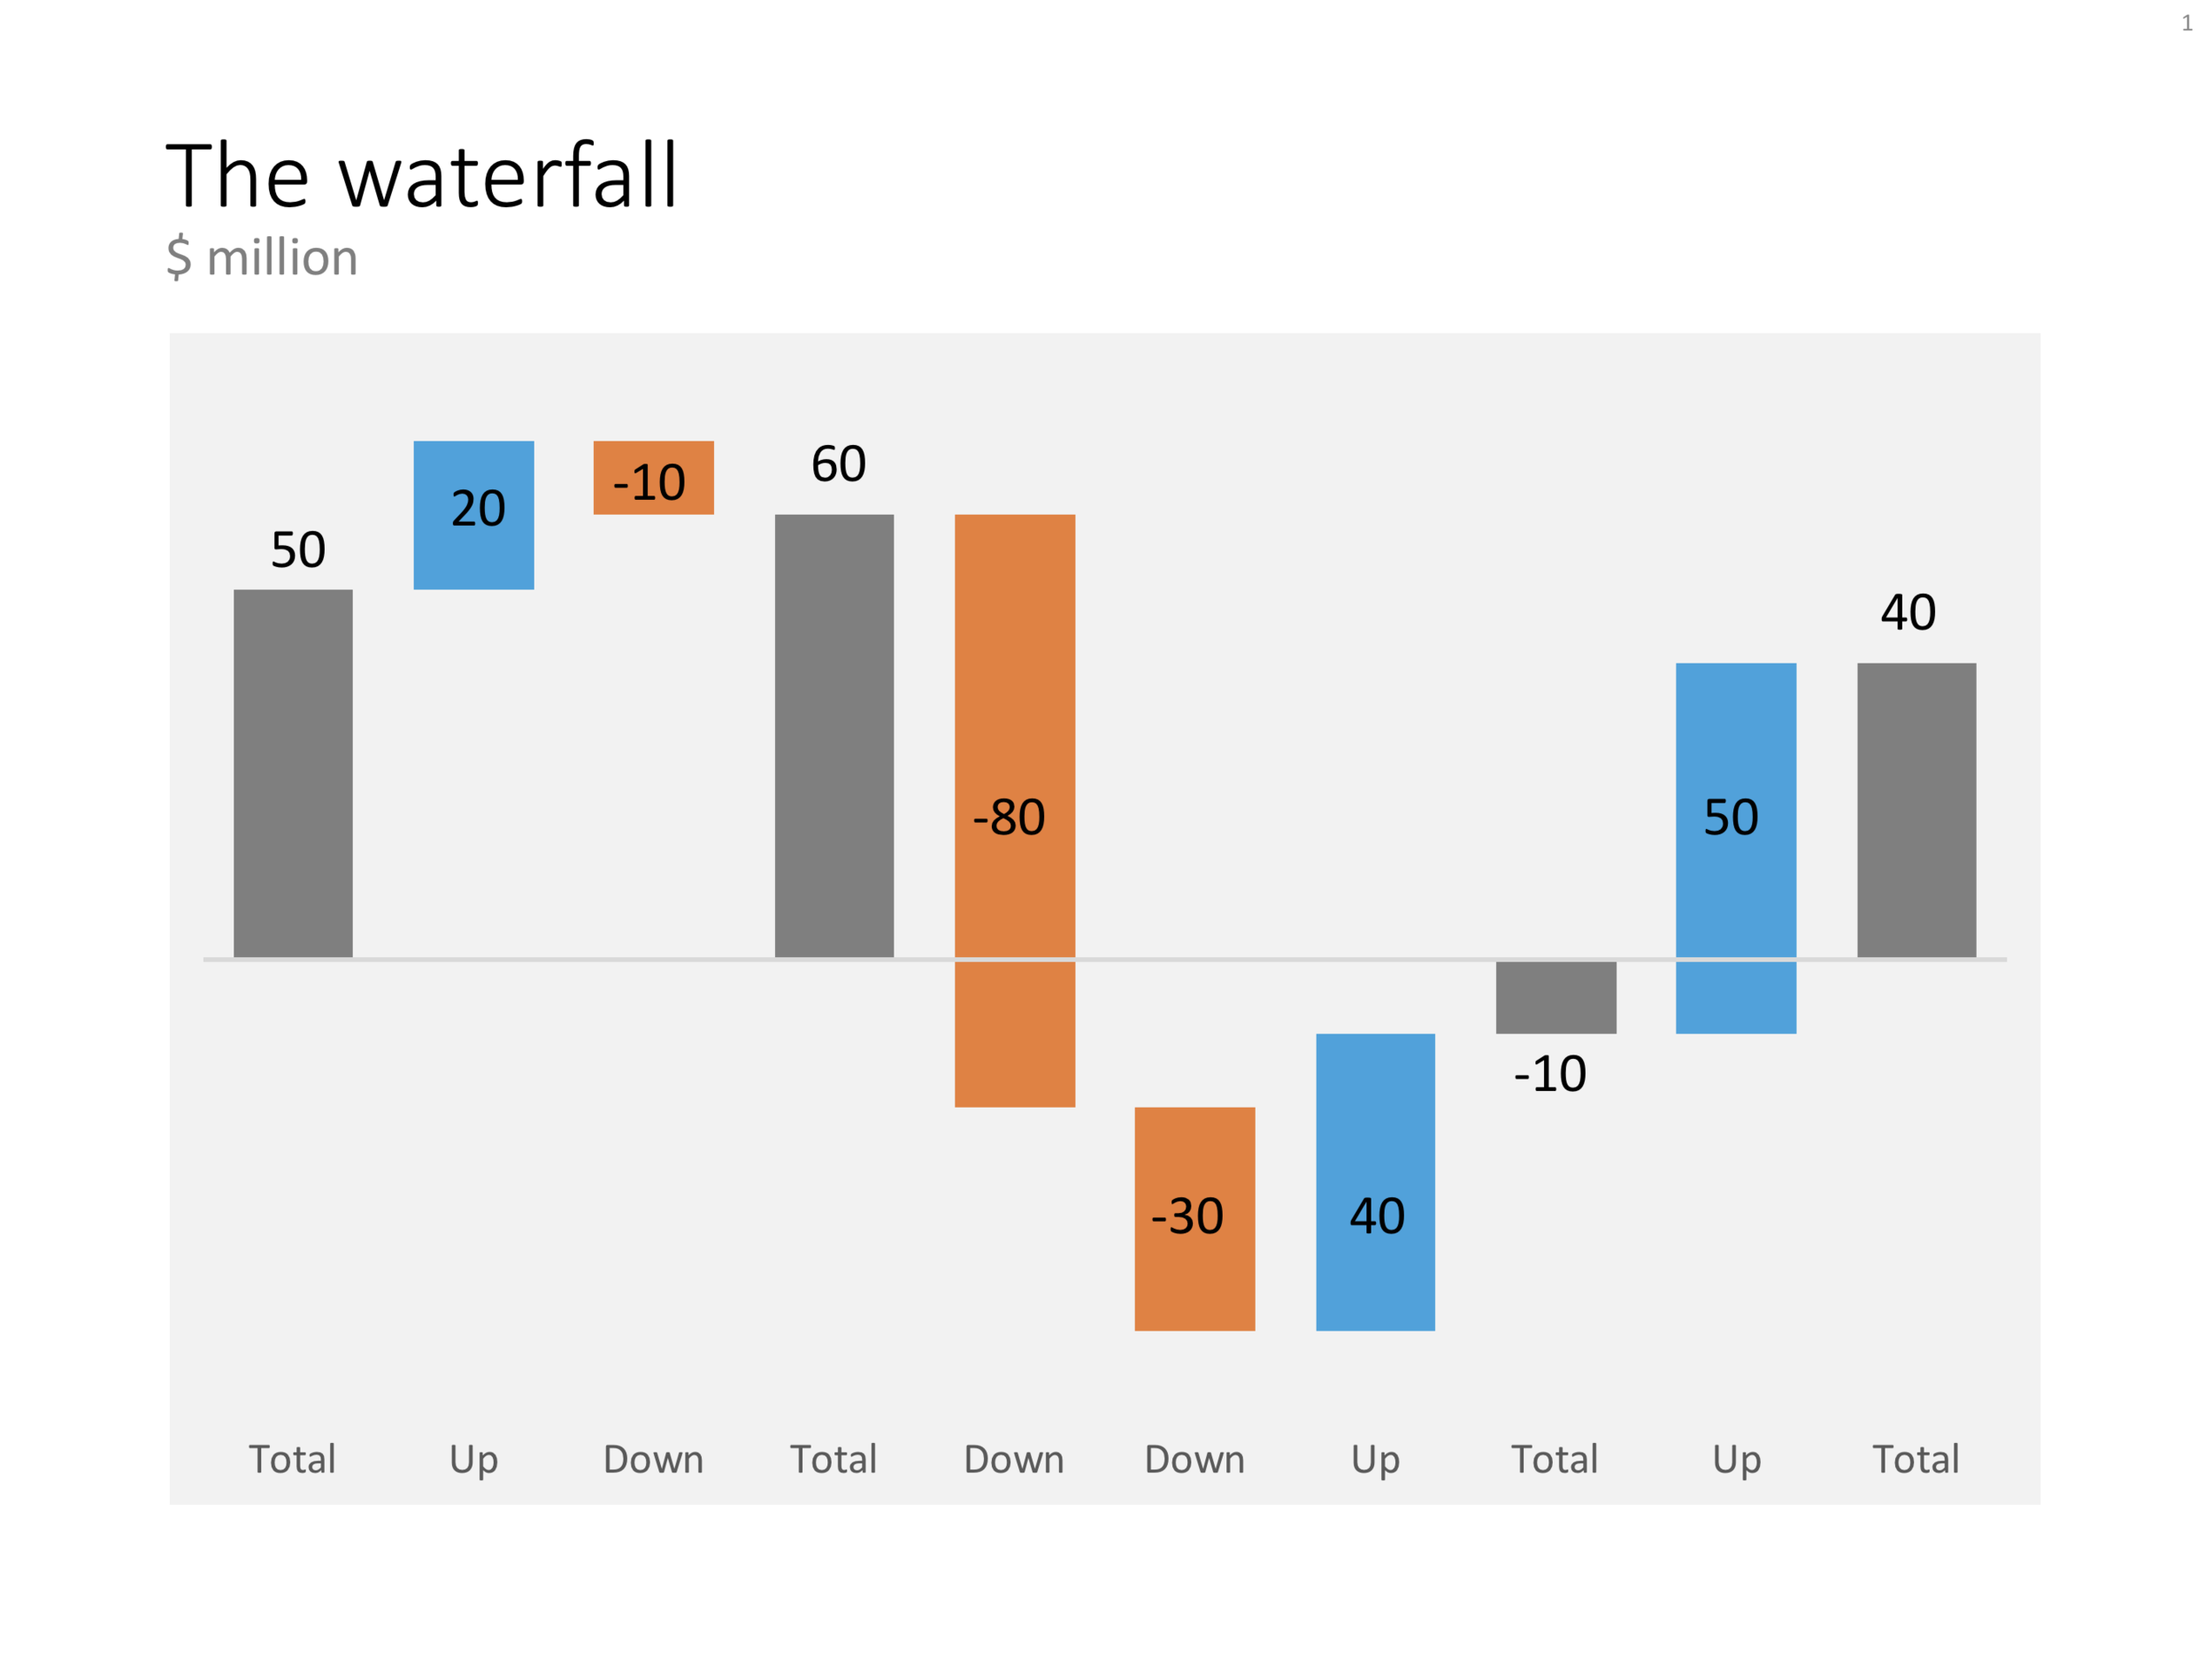
The "manual" waterfall chart in PowerPoint that can be downloaded from the template store
Photo by Talen de St. Croix on Unsplash